Show the code
# load the libraries
#devtools::install_github("ropensci/rnaturalearthhires")
library(ggrepel)
library(sf)
library(rnaturalearth)
library(rnaturalearthdata)
library(readxl)
library(stringr)
library(dplyr)
source(here::here("theme_health_radar.R"))
# Define the Rwanda provinces
rwanda_provinces <- c("East", "South", "West", "North", "Kigali city")
# Load the map data for Rwanda
rwanda_map <- ne_states(country = "Rwanda", returnclass = "sf") %>%
mutate(name = rwanda_provinces)
# Read in data
rwandap_data <- read_excel("data/rwanda_q1_provinces2022.xlsx")
cases <- rwandap_data$MalariaTotalCases
# Merge the map data with your data
rwanda_data <- rwanda_map %>%
left_join(rwandap_data, by = c("name" = "province"))
# Create a ggplot object with the Rwanda data
ggplot(data = rwanda_data) +
# Add a spatial plot with fill based on the number of cases
geom_sf(aes(fill = cases), color = "lightgrey", size = 0.3) +
# Apply custom theme
theme_health_radar() +
# Apply custom fill scale for continuous data
scale_fill_continuous_health_radar(name = "Total Cases") +
# Add text labels for the names, with color based on the number of cases
geom_sf_text(
aes(label = name, color = ifelse(cases > quantile(cases, 0.9), "black", "white")), size = 3) +
# Use identity scale for color
scale_color_identity() +
# Customize the theme to remove axis titles and ticks
theme(
plot.caption.position = "plot",
axis.title.x = element_blank(),
axis.text.x = element_blank(),
axis.ticks.x = element_blank(),
axis.title.y = element_blank(),
axis.text.y = element_blank(),
axis.ticks.y = element_blank(),
panel.grid.major = element_blank(),
panel.grid.minor = element_blank()) +
# Add caption and title to the plot
labs(
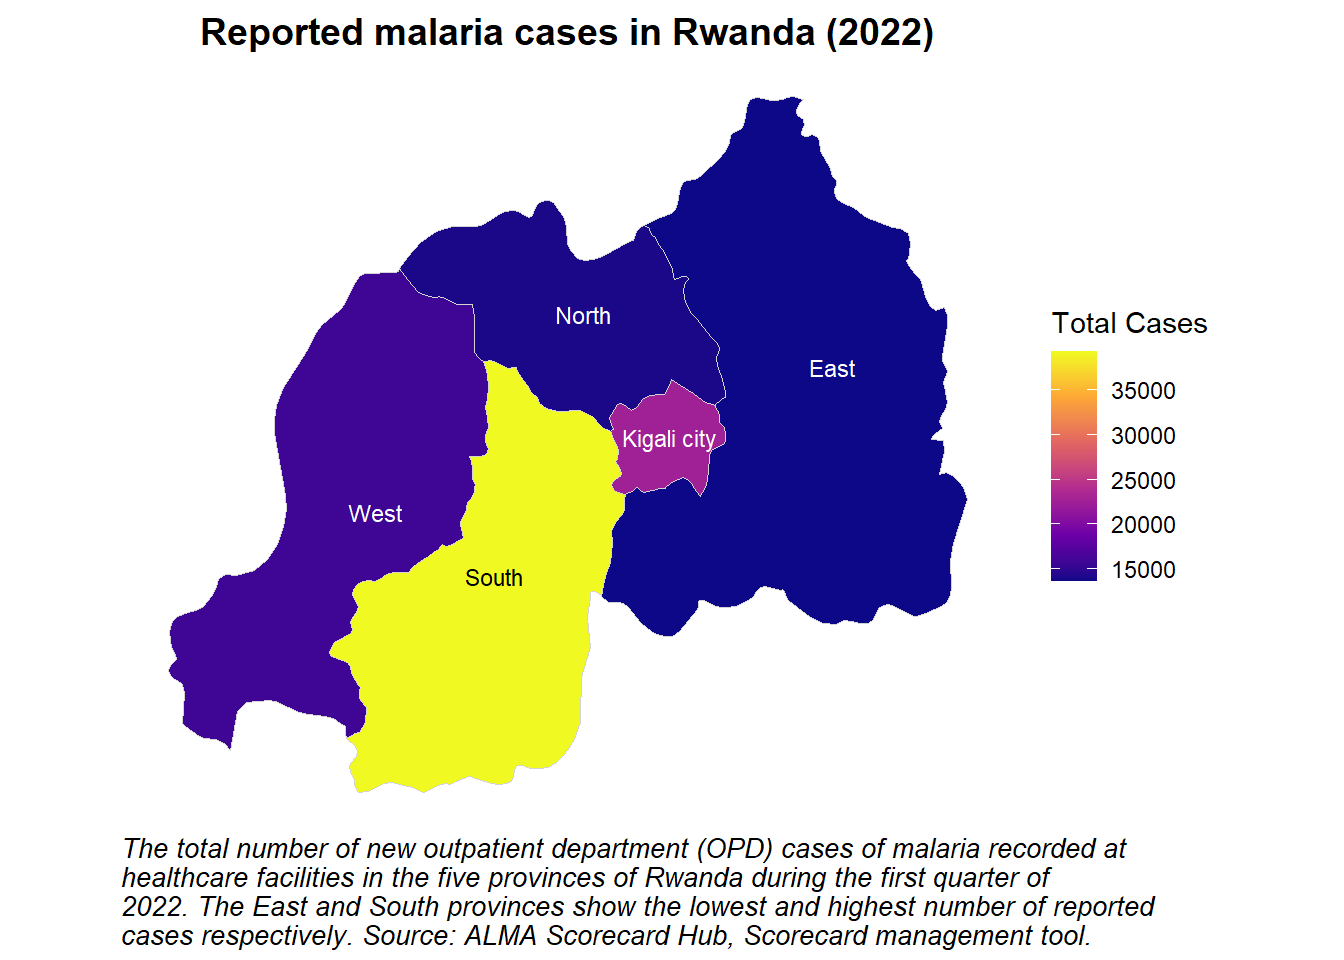
title = "Reported malaria cases in Rwanda (2022)",
caption = str_wrap(
"The total number of new outpatient department (OPD) cases of malaria recorded at healthcare facilities in the five provinces of Rwanda during the first quarter of 2022. The East and South provinces show the lowest and highest number of reported cases respectively. Source: ALMA Scorecard Hub, Scorecard management tool.",
width = 85))