WHO Global database on invasive mosquito vector species. At present, the database contains data on detection of Anopheles stephensi outside of its native ecosystems.
The global database on invasive mosquito vector species was established in 2019 following the recommendations of the WHO’s first Technical Consultation on the spread of Anopheles stephensi. The database is designed to allow tracking of the geographical spread of malaria vector species that pose a threat to malaria control and elimination efforts. The database aims to support the evaluation of risks posed by invasive vector species and to promote and inform prompt action to mitigate this risk.
These datasets provide information on long term trends in distribution and spread of new or emerging mosquito vectors of malaria and enable tracking the spread of invasive vector species such as Anopheles stephensi comparison between countries. The data provided are on an annual time scale at the national level and would not be suitable for subnational analysis or to explore seasonal trends in malaria.
Tracking surveillance activities helps to understand current research gaps. Knowledge of where studies are either being planned, currently underway, or recently completed, helps to inform where to direct resources for future studies.
Accessing the data
The data can be accessed via the WHO website through its Global Malaria Programme page on the Malaria Threats Map. The data has a web page which includes useful contextual information as well as additional resources. The data can be viewed in the original report in excel format as it is usually preferable for modelling to have an excel spreadsheet.
Select the theme Invasive Vector Species to access the Invasive Vector Species detections.
Data can be filtered according to species and year (1984-2024) in which collected.
Filter can be applied according to location.
Follow the prompts to select and download data.
The data is downloaded as an Excel file.
The downloaded data can be plotted according to the geography for which the filters were selected (species, year collected and location). At this stage, dashboard summaries are not available for this thematic area.
What does the data look like?
Sometimes the data needs to be prepared before it is able to be plotted.
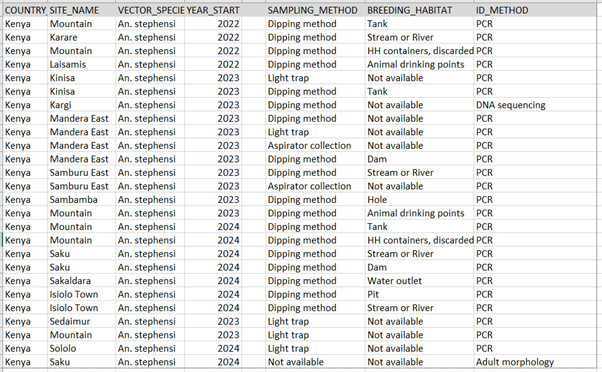
Figure 1: Distribution of Anopheles stephensi in Kenya for 2022-2024.
The distribution of An. stephensi was plotted for all districts in Kenya between 2022-2024. The method employed for collecting the specimens were recorded and the main methods of collection were the dipping method for mosquito larvae and the use of the light trap for collection of adult mosquitoes. The species identification was confirmed using molecular techniques.
Description
The data can be viewed as a spreadsheet, plotted on a map to show distribution or as a dashboard giving a summary of epidemiological and entomological data. The data can also be downloaded as Excel documents from the “Download Data” page.
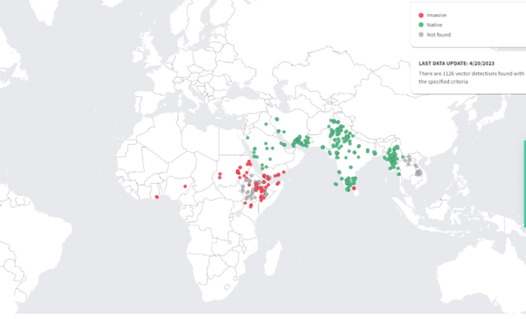
Figure 2: The occurrence of all invasive species from 2010 – 2024.
Figure 2 shows the distribution of all invasive mosquito species in Africa and south-east Asia for the past 14 years. It is apparent that An. stephensi is native to south-east Asia but it is an invasive species in north Africa. A number of sites were negative for An. stephensi. This information can be used for revising malaria control protocols.
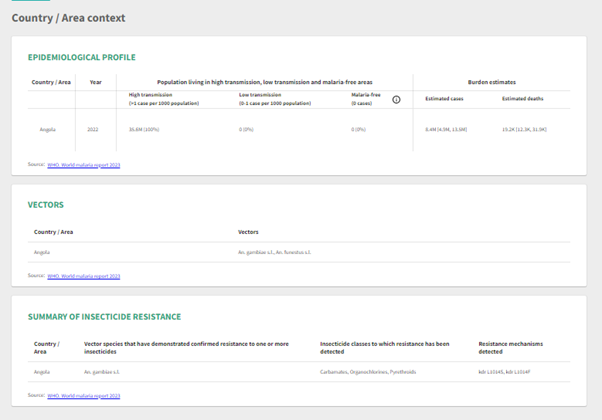
Figure 3: Sample of the summary dashboard that can be created using the distribution data.
Figure 3 shows a snap-shot of the summary data that can be generated from the selected dataset with the use of the appropriate filters. In this example, the vectors of Angola are listed and it is evident that An. stephensi has not yet moved down along the west coast of Africa. The insecticide resistance status of the vector mosquitoes is also given. The complete dashboard provides more information.
Citing the data
Please acknowledge the use of these datasets by including the following reference in your publications: https://apps.who.int/malaria/maps/threats/#/download. Include year, date of access, acknowledgement of the countries having provided the underlying data (in the event that the source refers to ministries of health or national malaria control programs of specific countries).
Examples of data use in literature
WHO initiative to stop the spread of Anopheles stephensi in Africa. 2023 (https://iris.who.int/bitstream/handle/10665/372259/WHO-UCN-GMP-2023.06-eng.pdf?sequence=1).
Al-Eryani, S.M., Irish, S.R., Carter, T.E. et al. Public health impact of the spread of Anopheles stephensi in the WHO Eastern Mediterranean Region countries in Horn of Africa and Yemen: need for integrated vector surveillance and control. Malar J 22, 187 (2023). https://doi.org/10.1186/s12936-023-04545-y
Mnzava, A., Monroe, A.C. & Okumu, F. Anopheles stephensi in Africa requires a more integrated response. Malar J 21, 156 (2022). https://doi.org/10.1186/s12936-022-04197-4
Abubakr M, Sami H, Mahdi I, Altahir O, Abdelbagi H, Mohamed NS, Ahmed A. The Phylodynamic and Spread of the Invasive Asian Malaria Vectors, Anopheles stephensi, in Sudan. Biology (Basel). 2022 Mar 7;11(3):409. doi: 10.3390/biology11030409. PMID: 35336783; PMCID: PMC8945054.
Ismail, R.B.Y., Bozorg-Omid, F., Osei, J.H.N. et al. Predicting the environmental suitability for Anopheles stephensi under the current conditions in Ghana. Sci Rep 14, 1116 (2024). https://doi.org/10.1038/s41598-024-51780-7
A new malaria vector in Africa: Predicting the expansion range of Anopheles stephensi and identifying the urban populations at risk. September 2020. Proceedings of the National Academy of Sciences DOI:10.1073/pnas.2003976117
Kweka EJ. Anopheles stephensi: a guest to watch in urban Africa. Trop Dis Travel Med Vaccines. 2022 Apr 1;8(1):7. doi: 10.1186/s40794-022-00165-7. PMID: 35361266; PMCID: PMC8973991.
How to use this data
The data contained in the database can be explored through the interactive data visualization platform Malaria Threats Map. The platform provides a spreadsheet of the requested data in an Excel format. Distribution maps of the spread of invasive species can be generated from this data. A dashboard of malaria epidemiology and entomology can also be accessed via this website.
How to plot this data
To access the specific data used in the visualisations:
Below the right-most window labelled ‘Data Download’, click on the ‘DOWNLOAD DATA’ button.
Select the ‘Invasive vector species’ tile.
Select ‘ADD TO DOWNLOAD’.
Select ‘NEXT STEP’. Follow the prompts to download your files.
Show the code
source(here::here("theme_health_radar.R")) # source in the theme functionslibrary(rdhs)library(ggrepel)library(sf)library(rnaturalearth)library(rnaturalearthdata)library(whowmr)library(dplyr)library(stringr)library(tidyr)library(forcats)
Show the code
# Define the elimination 8 countriesafrica_names <-c("Burundi", "Ethiopia", "Mozambique", "Sudan", "Djibouti", "Ghana", "Kenya", "Eritrea", "Nigeria", "United Republic of Tanzania")# Read in the data, and filter our countries outside of Africadata <- readxl::read_xlsx("data/MTM_INVASIVE_VECTOR_SPECIES_20250109.xlsx",sheet ="Data") |>filter(COUNTRY_NAME %in% africa_names)
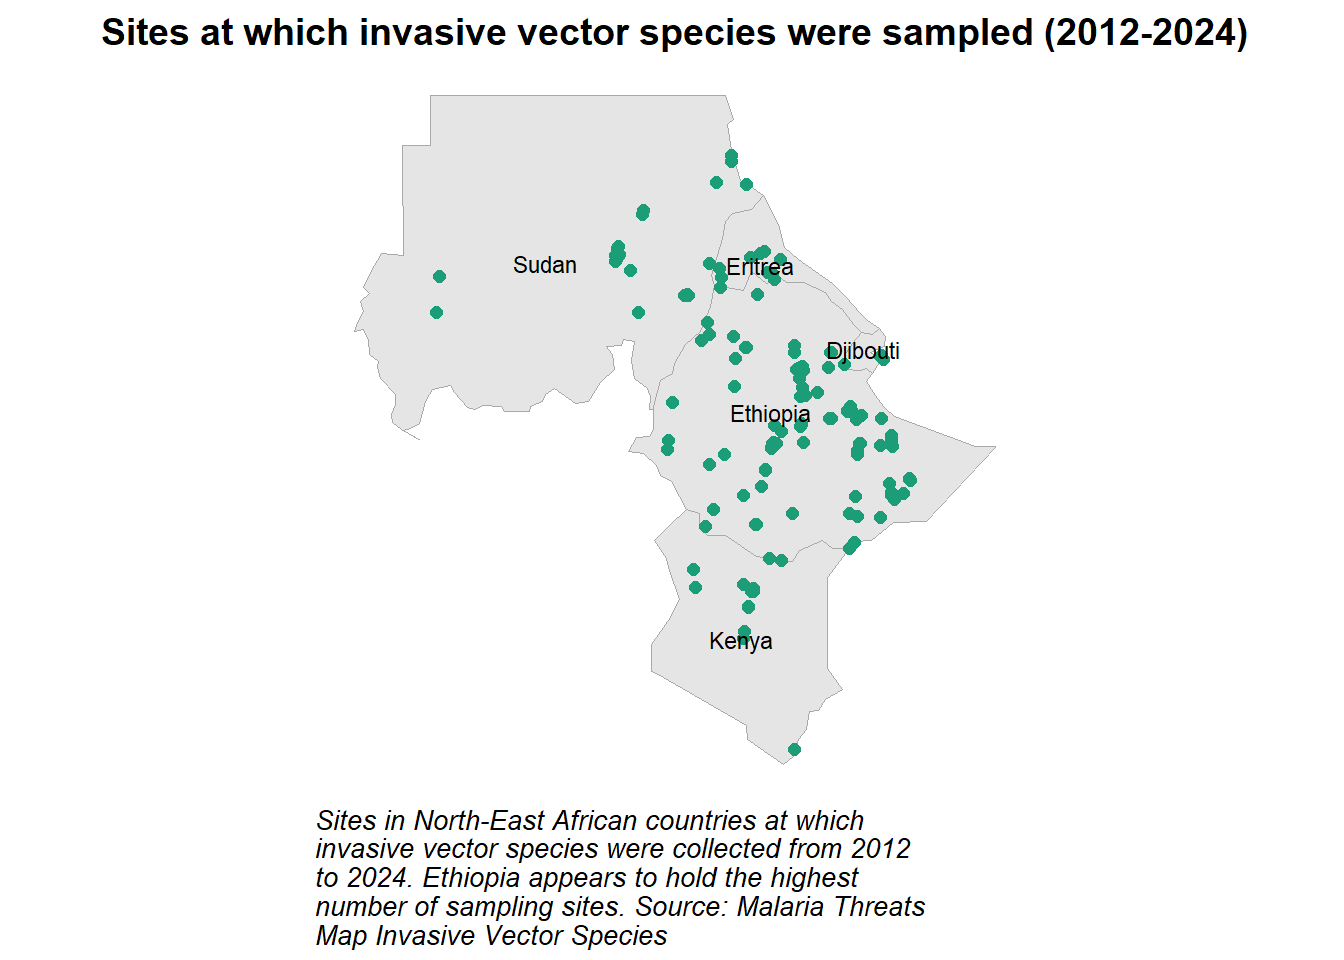
Visualising the spread of sites at which invasive vector species were sampled can be effectively done using a map.
Show the code
# Define a single colour for the plotsingle_color <-"#1b9e77"# Load the shapefile data for African countries and filter for specific countriesafrica <-ne_countries(continent ="Africa", returnclass ="sf") |># Correct the name "eSwatini" to "Eswatini"mutate(name =if_else(name =="eSwatini", "Eswatini", name)) |># Keep only the specified countriesfilter(name %in%c("Kenya", "Ethiopia", "Eritrea", "Djibouti", "Sudan")) # Convert LATITUDE and LONGITUDE columns to numericdata$LATITUDE <-as.numeric(data$LATITUDE)data$LONGITUDE <-as.numeric(data$LONGITUDE)# Filter the data for the specified countries and select relevant columnssites <- data |>filter(COUNTRY_NAME %in%c("Kenya", "Ethiopia", "Eritrea", "Djibouti", "Sudan")) |>select(COUNTRY_NAME, SITE_NAME, LATITUDE, LONGITUDE) # Create a ggplot object with the shapefile dataggplot(data = africa) +# Plot the shapefile data with grey bordersgeom_sf(color ="darkgrey", size =0.3) +# Add points for the sites, coloured by the single color defined abovegeom_point(data = sites, aes(x = LONGITUDE, y = LATITUDE), colour = single_color, size =2) +# Add text labels for the country namesgeom_sf_text(aes(label = sovereignt), color ="black", size =3) +# Apply custom themetheme_health_radar() +# Customize the theme to remove the x- and y-axes and grid linestheme(plot.caption.position ="plot",axis.title.x =element_blank(),axis.text.x =element_blank(),axis.ticks.x =element_blank(),axis.title.y =element_blank(),axis.text.y =element_blank(),axis.ticks.y =element_blank(),panel.grid.major =element_blank(), panel.grid.minor =element_blank() ) +# Add labels and title to the plotlabs(title ="Sites at which invasive vector species were sampled (2012-2024)",caption =str_wrap("Sites in North-East African countries at which invasive vector species were collected from 2012 to 2024. Ethiopia appears to hold the highest number of sampling sites. Source: Malaria Threats Map Invasive Vector Species", width =50))
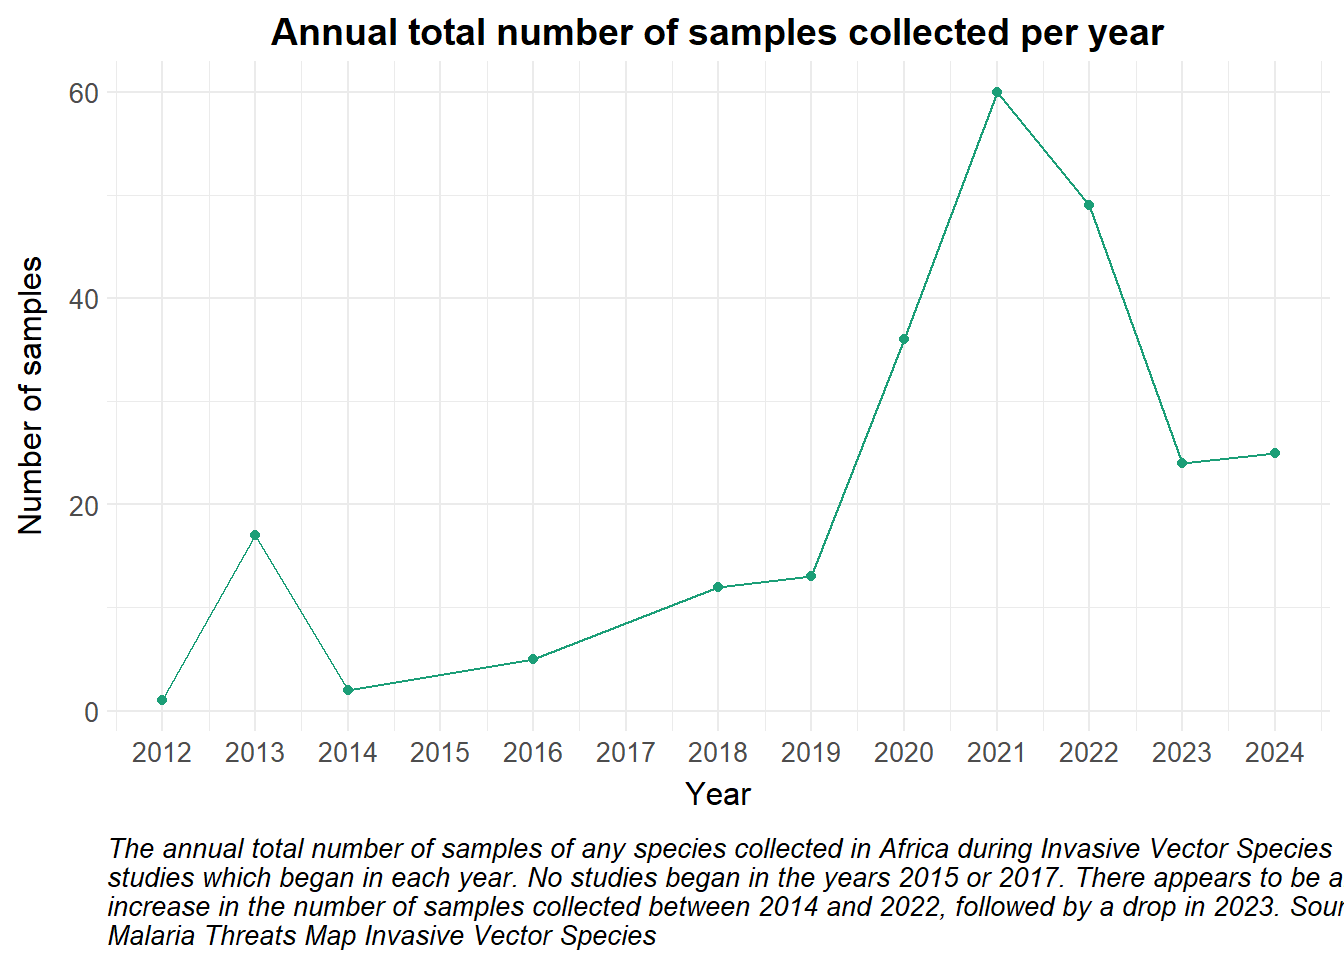
A line plot is used to visualise the total number of Invasive Vector Species study samples collected each year. Including points at each data point is important for communicating that this data was collected annually, not continuously, and that data is not available every year.
Show the code
# Filter the data to include only rows where YEAR_START is not NAdata |>filter(is.na(YEAR_START) ==FALSE) |># Count the number of samples for each yearcount(year = YEAR_START) |># Create a ggplot object with the counted dataggplot(aes(x = year, y = n)) +# Add a line plot to the chart, coloured by single_colorgeom_line(colour = single_color) +# Add points to the plot, coloured by single_colorgeom_point(colour = single_color) +# Apply custom themetheme_health_radar() +# Customise the x-axis to show yearly breaksscale_x_continuous(breaks =min(data$YEAR_START):max(data$YEAR_START)) +# Add labels and title to the plotlabs(x ="Year",y ="Number of samples",title ="Annual total number of samples collected per year", caption =str_wrap("The annual total number of samples of any species collected in Africa during Invasive Vector Species studies which began in each year. No studies began in the years 2015 or 2017. There appears to be an increase in the number of samples collected between 2014 and 2022, followed by a drop in 2023. Source: Malaria Threats Map Invasive Vector Species", width =105))
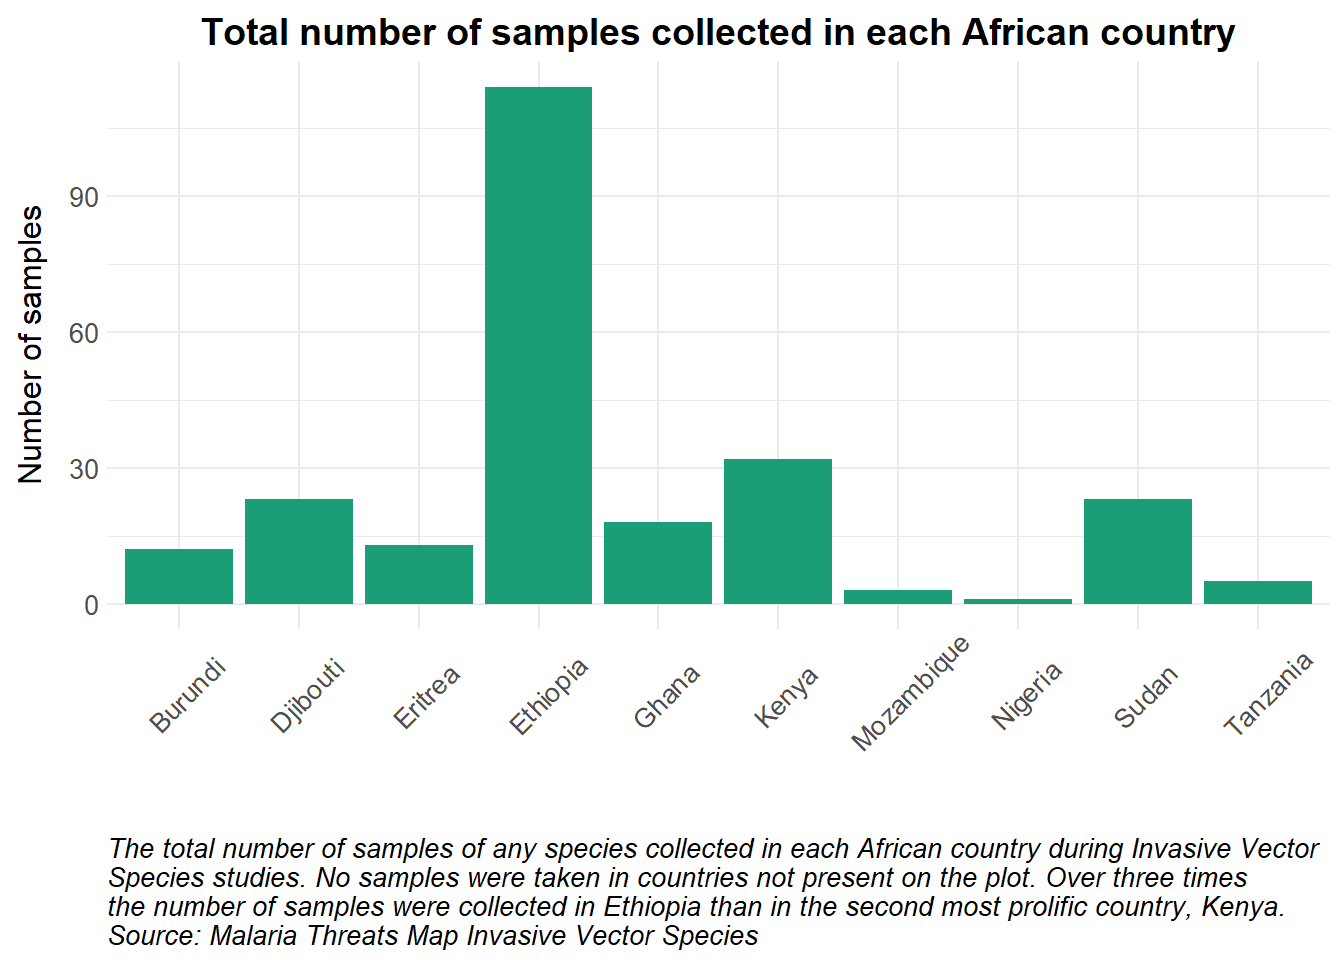
Lastly, we look at the total number of Invasive Vector Species study samples collected in each country, rather than in each year. As the x-variable is categorical and not continuous, a bar plot is used.
Show the code
# Define a single color for the barssingle_color <-"#1b9e77"# Modify the COUNTRY_NAME to replace "United Republic of Tanzania" with "Tanzania"data |>mutate(COUNTRY_NAME =ifelse(COUNTRY_NAME =="United Republic of Tanzania", "Tanzania", COUNTRY_NAME)) |># Count the number of samples for each countrycount(COUNTRY_NAME) |># Create a ggplot object with the counted dataggplot(aes(x = COUNTRY_NAME, y = n)) +# Add bar plots to the chart, filled with the single colourgeom_bar(stat ="identity", fill = single_color) +# Apply custom themetheme_health_radar() +# Customize the x-axis text to be angled and adjustedtheme(axis.text.x =element_text(angle =45, hjust =0.4)) +# Add labels and title to the plotlabs(x ="",y ="Number of samples",title ="Total number of samples collected in each African country", caption =str_wrap("The total number of samples of any species collected in each African country during Invasive Vector Species studies. No samples were taken in countries not present on the plot. Over three times the number of samples were collected in Ethiopia than in the second most prolific country, Kenya. Source: Malaria Threats Map Invasive Vector Species", width =100))
How can this data be used in disease modelling?
Data on invasive mosquito vector species can be used in a range of malaria modelling applications:
To project the spread of disease if transmission efficiency of the invasive vector differs to the native vector, or their combined effects can inform the overall vectorial capacity in a given context.
When used in conjunction with other data sources such as climate projections, land cover or population density data, the location of the invasive species collected can be used to model population dynamics, as done by Da Re, D. et al. (2022) in their exploration of invasive Aedes species.
This can further inform spatial risk mapping and/or be used to forecast further invasions of the species.
These findings can also be used as inputs for models that evaluate intervention impact, as far as targeted vector control and changes in their effectiveness due to the presence of invasive species.