| Type | Examples |
|---|---|
| Case surveillance data | Reported counts of confirmed and/or suspected cases, hospitalisations, and deaths collected through national or sentinel systems. |
| Demographic data | Population size, age and sex structure, births and deaths, and migration records. |
| Entomological data | Vector density, species distribution. |
| Environmental and climatic data | Temperature, rainfall, humidity, vegetation, and land use. |
| Health system data | Facility catchment, treatment availability, intervention distribution (e.g., ITNs, vaccines), and healthcare utilisation rates. |
| Behavioural and mobility data | Human movement, contact patterns, and health-seeking behaviours derived from surveys, GPS, or mobile data. |
| Serological data | Antibody or antigen prevalence indicating historical exposure, immunity, or infection patterns. |
A. Types of Modelling Data
1. Observational Data
Observational data are empirically collected from surveillance systems, health records, field studies, or surveys. These data capture real-world observations of populations, environments, and disease occurrence. While surveillance systems and health records are maintained on governmental databases and require a data-sharing agreement to access, field studies and surveys are often conducted by researchers and made available in academic journals. Sometimes, data from surveys conducted across multiple countries are housed on public platforms. The Demographic and Health Survey source of data is an example of this.
There are many types of data required for disease models. Depending on the disease, some types of data will be more important than others. Table 1 contains a description of different types of data commonly used in disease models. These data could be available at a different administrative levels (national/ sub-national) and disaggregated by age, sex and other risk groups.
2. Estimated Information
Estimated information, which is sometimes mislabelled as data but still important for disease modelling, is generated through inference, statistical modelling, or disease modelling when direct observation is limited or incomplete. These represent interpreted or model-inferred quantities. As an example, the Malaria Atlas Project provides estimates of malaria prevalence in 2-10 year olds. Table 2 contains a description of different types of estimated information commonly used as inputs or validation points in disease models. These estimates and their uncertainty ranges could be available at a different administrative levels (national/ sub-national) and disaggregated by age, sex and other risk groups.
| Type | Description |
|---|---|
| Transmission parameters | Estimated measures such as the basic reproduction number (R₀), force of infection, or contact rate. |
| Intervention effectiveness | Derived measures of vaccine efficacy, treatment failure, or intervention coverage, population adherence. |
| Under-reporting adjustments | Corrected case or mortality estimates accounting for incomplete surveillance or diagnostic capacity. |
| Modelled incidence and prevalence | Predicted disease burden over time derived from statistical or mechanistic models. |
| Mobility and contact matrices | Inferred patterns of interaction between age, spatial, or occupational groups. |
3. Metadata and Data Quality
This source of essential information describes how data were collected, curated, and validated. This helps to assess the credibility, comparability, and interpretability of datasets used in modelling. Table 3 describes key sources of metadata to contextualise observed data and estimated information.
| Type | Description |
|---|---|
| Data completeness | Proportion of observational data actually reported or recorded in the health system databases across time or space. |
| Data provenance and documentation | Source details, collection methodology, and transformations applied before analysis. |
| Official reports | Governmental documents such as national strategic plans, operational plans, budgets, annual progress reports and reviews. |
| Standardisation and harmonisation | Use of consistent formats, definitions, and coding schemes enabling integration across sources. |
| Ethical and legal considerations | Metadata on data ownership, consent, and use permissions, ensuring responsible data sharing and application. |
B. Disease Models
Mathematical mechanistic models are tools that use mathematics, biological and epidemiological principles and logic to create synthetic populations on a computer. These have features similar to real populations where options for disease control interventions are being considered.
Below is a high-level overview of different mechanistic disease model classes. While these are presented separately, they are often combined in practice, for example, an age-structured compartmental model that is simulated stochastically.
Compartmental Models (e.g., SIR, SEIR, SEIRS)
- Core Methodology: Differential equations representing population movement between disease states.
- Key Features: Populations divided into compartments (Susceptible, Exposed, Infectious, Recovered, etc.).
- Common Use Cases: General transmission dynamics and broad intervention evaluation.
- Strengths: Simple, interpretable, and computationally efficient.
- Limitations: Assumes homogeneous mixing; ignores individual variation.
Age-structured / Demographic Models
- Core Methodology: Extends compartmental models with age or risk group stratification.
- Key Features: Tracks population by age, sex, or risk level.
- Common Use Cases: Comparing interventions between specific age groups (e.g., schools vs. elderly care).
- Strengths: Captures heterogeneity; informs highly targeted interventions.
- Limitations: Requires detailed demographic data; increases mathematical complexity.
Spatial / Metapopulation Models
- Core Methodology: Divides populations into spatial units connected by movement.
- Key Features: Incorporates travel, migration, or vector dispersal.
- Common Use Cases: Regional transmission, outbreak spread, and importation risk (e.g., airport travel).
- Strengths: Explicitly models geography and connectivity.
- Limitations: Computationally demanding; requires high-quality spatial and travel data.
Vector-borne Transmission Models
- Core Methodology: Links human and vector populations via transmission parameters.
- Key Features: Includes mosquito, tick, or other vector compartments.
- Common Use Cases: Malaria, Dengue, Zika.
- Strengths: Represents the human–vector interaction cycle explicitly.
- Limitations: Requires vector-specific data (biting rates, survival, distribution).
Stochastic Models
- Core Methodology: Adds randomness to transmission and progression processes.
- Key Features: Uses probabilities instead of deterministic (fixed) rates.
- Common Use Cases: Small populations or capturing early outbreak dynamics.
- Strengths: Captures chance events and “extinction” probabilities.
- Limitations: Computationally heavy; requires multiple model runs to get an average.
Individual-based (Agent-based) Models
- Core Methodology: Simulates individual entities with unique attributes and behaviors.
- Key Features: Tracks each person’s specific state and interactions over time.
- Common Use Cases: Contact tracing, behavior-driven epidemics, and complex intervention analysis.
- Strengths: Highly detailed, flexible, and realistic.
- Limitations: Very data-intensive; slow to run; difficult to calibrate.
Network Models
- Core Methodology: Represents individuals as nodes and contacts as edges.
- Key Features: Uses network theory to model social or physical interactions.
- Common Use Cases: HIV, COVID-19, and other sexually transmitted infections.
- Strengths: Captures heterogeneity in contacts and social clustering.
- Limitations: Requires social network data; complex to parameterize.
Hybrid / Multi-scale Models
- Core Methodology: Combines multiple methods (e.g., agent-based + differential equations).
- Key Features: Links dynamics across scales (from individual to whole population).
- Common Use Cases: Large-scale policy simulations and complex transmission settings.
- Strengths: Balances realism with computational tractability.
- Limitations: Extremely complex to design, code, and validate.
C. Key considerations when using data as inputs to models for parameterisation or calibration
1. Data Quality and Reliability
- Completeness: Check for missing data, underreporting, or incomplete records.
- Accuracy: Assess potential measurement errors or misclassification (e.g., false positives/negatives).
- Consistency: Verify that data sources use consistent definitions and collection methods over time.
- Timeliness: Ensure data are up-to-date and reflect current or historical epidemiological conditions as needed.
2. Data Relevance and Appropriateness
- Epidemiological relevance: Confirm that data correspond to the disease, population, and context being modelled.
- Temporal and spatial resolution: Match data frequency and geographic scale to the model’s structure (e.g., daily vs. annual, district vs. national).
- Alignment with model compartments: Ensure data map correctly to model states (e.g., incidence vs. prevalence).
3. Data Integration and Compatibility
- Multiple data sources: When combining datasets (e.g., surveillance, surveys, lab, climate), check for consistency and avoid double-counting.
- Standardisation: Harmonise variable formats, units, and definitions across sources.
- Metadata: Retain and review metadata for context, collection methods, and limitations.
4. Representativeness
- Population coverage: Evaluate whether data capture key subpopulations (e.g., rural areas, private sector, asymptomatic cases).
- Bias: Identify sampling bias, reporting bias, or selection bias that could distort model outputs.
5. Contextual Understanding
- Health system effects: Consider reporting practices, diagnostic access, or changes in policy that affect data trends.
- External drivers: Integrate contextual variables (e.g., mobility, climate, interventions) that influence disease dynamics.
- Expert input: Engage local or domain experts to interpret data patterns and validate assumptions.
6. Ethical and Governance Considerations
- Data privacy: Protect identifiable or sensitive health information.
- Permissions and ownership: Respect data-sharing agreements and attribution.
- Transparency: Document data sources, transformations, and assumptions clearly for reproducibility.
In relation to the model development, the following should also be considered
1. Uncertainty and Variability
- Measurement uncertainty: Quantify uncertainty ranges where possible.
- Natural variability: Account for stochasticity or seasonality in transmission or reporting.
- Scenario testing: Use sensitivity or uncertainty analyses to understand model dependence on data assumptions.
2. Calibration and Validation
- Model calibration: Choose appropriate parameters to fit data, ensuring that calibration is statistically sound (e.g., MCMC, optimisation).
- Validation: Compare model predictions to independent datasets or samples from datasets not used in calibration.
- Overfitting: Avoid tuning parameters too closely to one dataset at the expense of generalisability.
D. The Modelling Process
Building and implementing a model is not a single step but a continuous, iterative process that links conceptual understanding, data analysis, and model refinement to inform public health decisions. It is a multi-stage process that integrates data, assumptions, and analytical methods to generate insights about disease dynamics and intervention impact.
The following are key steps in the modelling process:
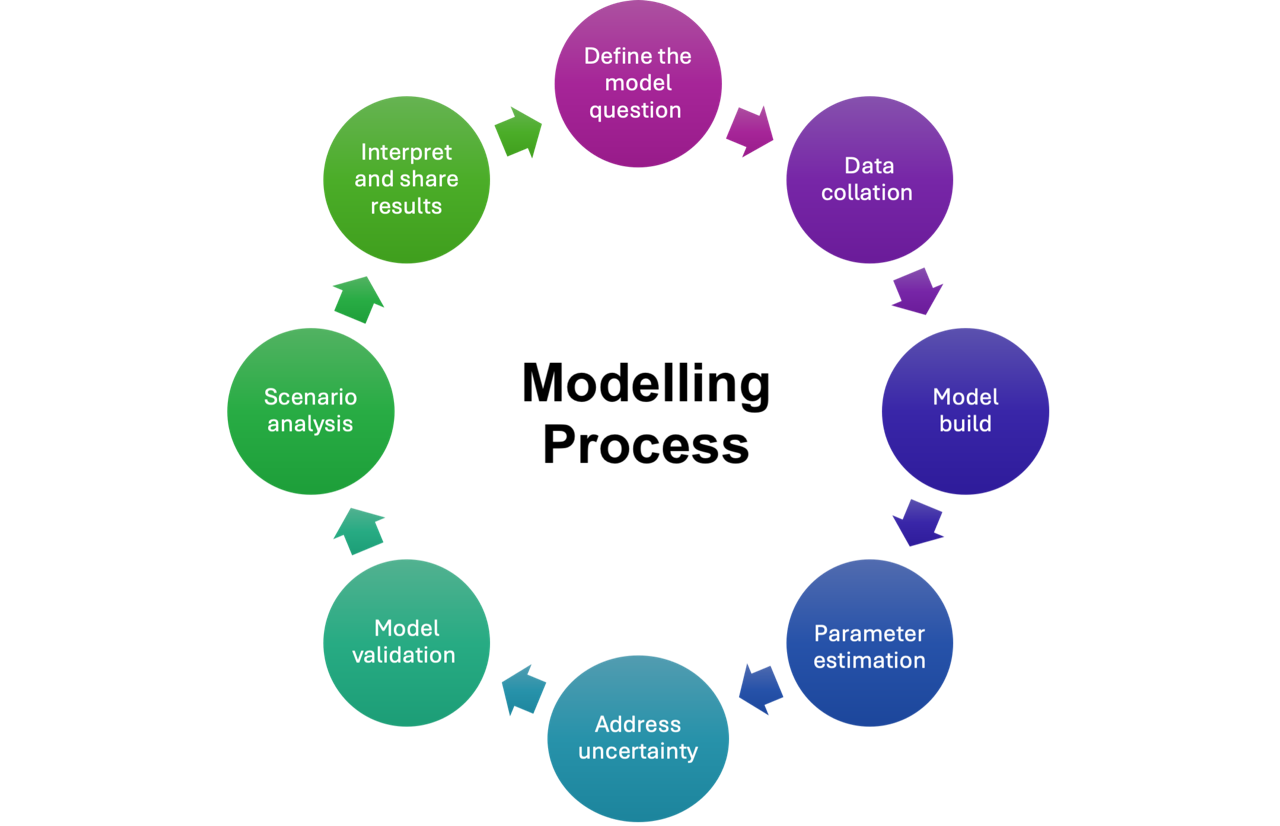
- Define the modelling question: Modelling begins with defining a clear question that directly connects to a policy issue and can be answered using a model along with existing data and evidence.
- Data collation: Gathering and understanding the available data. This step involves identifying what information is available, recognising gaps or limitations, and finding alternative solutions
- Model Building: Choosing the appropriate model features to include in the structure is key, as is designing the software or code that will bring it to life.
- Parameter estimation: Identify and select key values that will influence the model, and determine how best to manage and guess at unknown values
- Addressing uncertainty: As all models need to make assumptions and have limitations, it is important to address uncertainty by identifying and accounting for possible sources of error.
- Model validation: Here the model is tested for accuracy and compared with other models or data sources, including comparing model outputs with what is known to have happened in the past (e.g., historic disease incidence or hospitalizations).
- Scenario analysis: Scenario analyses are performed, to allow for examining various strategies to see how different versions of the future might evolve
- Interpret and share results: Interpret the model results by comparing different scenarios to a baseline (i.e., status quo) to help clarify the impact of potential decisions. Communicating the model should involve clear and plain language, information about its assumptions, and the limitations of the model. This helps policymakers and other stakeholders to trust and understand the findings and better judge their potential validity.